Today’s investigation is into the world of software profiling, with the open source profiling tool gprof. Gprof is a tool for unix systems that analyzes the performance of a another program. It does this by inserting additional code when compiling that other program, so that it can provide a great level of detail in its analysis.
I chose to run this test gprof with one of my programs made for lab 5 of SPO600. The program scales fake “sound samples” (random integers in this case). I have prepared the program to run extra samples, for a longer run time and better profiling. With 1,000,000,000 samples, it takes about 53 seconds to run. After compiling with -g -pg -O3 options on the gcc compiler. After compiling, once we run the program we find an extra file in the directory called gmon.out.
Running gprof on our executable, we gave me this:

Unfortunately, there isn’t any content in the profile. Some searching led me to recompile it differently to avoid a bug in gcc. Now get one new line to show up.
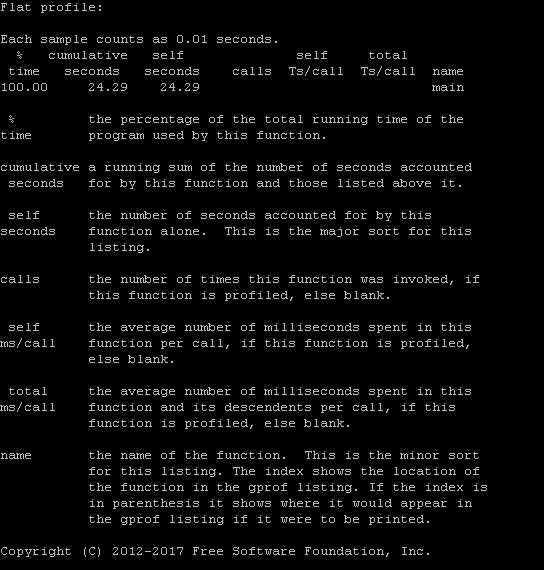
The bulk of this is an explanation of what each stat means.
The name is main, the name of the function being profiled in this line. It seems that you can look at each function individually and its impact. Since there is only one function defined in this program, it takes up 100% of the time. And since no functions are being called inside of main, self seconds and cumulative seconds are the same. The other categories (involving the function being called) are left empty, perhaps because main is a special function, and doesn’t get profiled in this way.
